CS-Shutterfy-Hero-Pattern

CASE STUDY Shutterfly proves Cash Back is an effective performance lever

Challenge

Shutterfly proves the effectiveness of Cash Back with an elasticity test
As part of a larger program analysis to ensure the most successful Q4, Shutterfly wanted to determine which Cash Back rates are most effective and efficient in driving their core KPIs.

Key Learnings

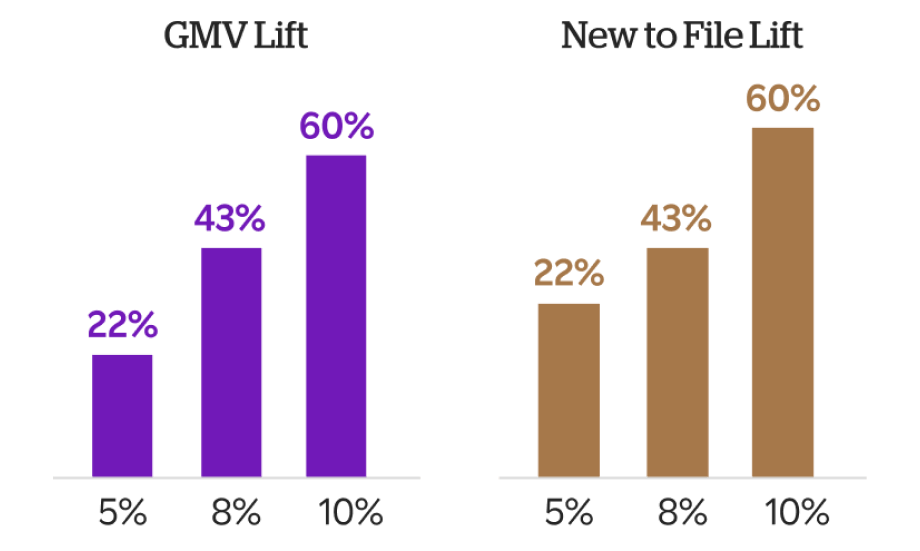
  • Cash Back rate improves GMV and new-to-files (NTFs) in an impressive, linear fashion.
  • Elevating Cash Back from 5%-8% drives significant uplift in shopping trips, while conversions exhibit an even higher growth rate at 10%.
  • Rakuten drives incremental growth while maintaining positive ROAS.
  • CS-Shutterfy-Chart
    graph
  • Cash Back is an effective performance lever
    Strategic use of Cash Back drives different business objectives:

    • Strong lifts in GMV and NTFs show the brand is highly responsive to changes in Cash Back.
    • The high responsiveness of the metrics to Cash Back suggests that ROAS will be more efficient at certain higher levels of Cash Back.
    • Lift in GMV as well as NTF suggests that Cash Back is an effective lever for driving engagement across critical member segments and topline revenue.
    graph

Test Methodology

The Approach

To ensure a statistically significant test, we predict the expected conversions of the intended audience, based on the preloaded audience groups and historical data analysis.

We use an A/B test calculator to predict the expected sample variation and need to achieve a large enough audience size.

Structure & Analysis

  • Audience base selected from past Rakuten.com shoppers
  • Statistical significance: measured based on conversions
  • Minimum detectable error: 10%
  • Assumed confidence interval: 95%
  • Expected duration: 15 days (~30 days max)

How

Why

  • Audience Selection
  • How

    Rakuten members who have initiated at least one (1) shopping trip in the past 6 months, across all categories and verticals.

    Random selection.

    Why

    Allows us us to complete an in-depth analysis of impact by different. Consumer segments and ensure no bias is present.

  • Randomization
    Randomization
  • How

    Audiences are split within the platform, using a randomization functionality.

    Why

    Ensures there is no selection bias by leveraging an industry-leading third-party tool.

  • cashback
    Cash Back Strategies
  • How

    Test multiple Cash Back groups to simulate program partnership and demonstrate the associated incrementality.

    Test three (3) Cash Back rates.

    Why

    Ensures actionable results and findings.

  • Gear
    Media Strategy
  • How

    Test media along with increased Cash Back.

    Understand the effectiveness of media + Cash Back vs. just increasing Cash Back.

    Why

    This structure will ensure actionable findings for media strategy.

Results

A strong catalyst for purchase

Cash Back has varying impact across the conversion funnel.

    • 8% Cash Back group generated much higher awareness than the 5%.
    • When looking at awareness, 8% vs. 10% did not make a big difference in impact. Changes in Cash Back rates are not linear and there is an inflection point.
    • Although the 8% and 10% groups generated similar lift in trips, the 10% group played a much stronger role in driving conversion.
    graph
  • graph

Learn how Rakuten merchants turn rewards into revenue and brand loyalty

cta-pattern

Ready to hear more?

Contact Us